The global retail trading space exhibits an insatiable addiction to spot gold (XAUUSD). Drawn by the alluring promise of massive daily pip expansions and rapid equity generation, thousands of active operators enter the gold arena daily. However, a stark mathematical reality separates retail speculative participants from institutional quantitative market makers: retail trades the visual pattern; the institution trades the underlying liquidity network. When gold experiences extreme momentum expansions near historical highs, standard technical indicators begin to experience catastrophic breakdown points. Surviving this environment requires an absolute structural paradigm shift—transitioning from simple chart-based systems to a systematic framework built on macro-correlation tracking, order-book depth analysis, and structural capital protection models.
Advanced Gold Strategy Cluster
To map out specific execution parameters and tactical micro-modules within this framework, read our specialized sub-analyses:
The Illusion of Pure Volatility: Chasing Spikes Into Voids
To the untrained speculator, gold's massive intraday swings appear to be random displays of market energy. This perspective represents a dangerous operational error. Every rapid price expansion, sudden multi-dollar crash, or structural breakout sequence is a direct mathematical consequence of order-book matching variations. Gold operates in a highly complex decentralized market network, drawing liquidity from global interbank consortiums, central bank desks, bullion clearinghouses, and commercial futures exchanges simultaneously.
When major macroeconomic updates or unexpected geopolitical events hit the wire, these primary liquidity providers do not stand in the line of fire. Instead, they instantly adjust their internal pricing algorithms, pulling large blocks of resting limit orders from the electronic matching book or widening execution spreads by orders of magnitude. The result is a severe structural liquidity vacuum.
Furthermore, these matching engines follow precise chronological cycles. Operating your strategy without isolating these shifting thickness profiles increases tail-risk exponentially. To map the global volume flows, interbank fixed settlement cycles, and tight layout windows, deploy our precise mathematical index outlining how global market hours govern spot gold liquidity and generate toxic voids.
Traders executing systems without real-time spread tracking are essentially gambling against the house. To understand how unhedged exposure vectors and excessive leverage models compound these execution errors under extreme market expansion, review our research on the mechanics of leverage collapse and margin call events.
Deconstructing the Institutional Liquidity Hunt
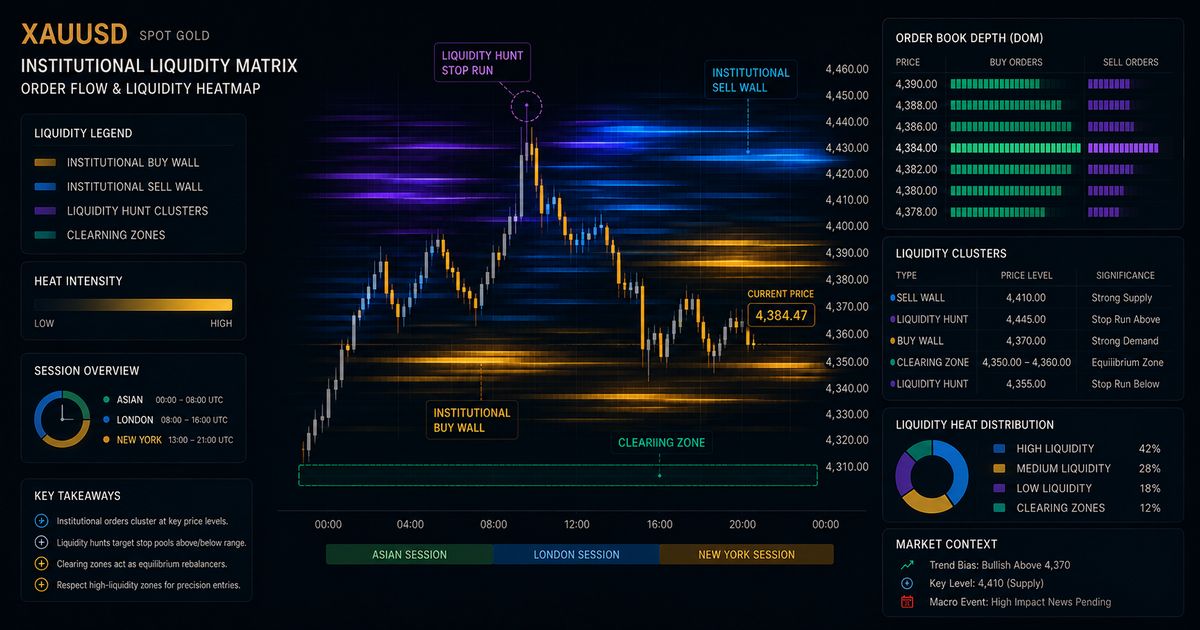
Why do gold prices routinely break past clear historical highs or lows, only to violently reverse directions a few minutes later? Retail spaces frequently blame this on broker manipulation or market anomalies. In the institutional domain, however, this sequence is recognized as a standard Liquidity Hunt Architecture.
Because institutional market operators control highly capitalized accounts, they cannot simply enter a buy or sell order at the market rate without triggering massive self-induced slippage. To execute a sizable position, they require an equal volume of counterparty orders. The most reliable concentrations of counterparty volume reside directly above major swing highs (where retail buy-stops and short stop-losses rest) and below prominent swing lows (where sell-stops and long stop-losses are clustered).
By purposefully pushing the spot price into these heavy order pools, institutional market makers trigger a wave of automated market executions. This provides the exact volume surge required for smart-money desks to fill their large positions. Once these orders are matched, the aggressive price momentum vanishes, and the market reverses into the true structural direction. If you are constructing automated systems without accounting for these institutional hunting zones, your strategy will continually buy local tops and sell local bottoms.
Cross-Asset Mechanics: The Real Yield and Dollar Interception
An isolated analysis of the XAUUSD chart will never yield long-term systematic consistency. Gold is an asset class that does not exist within a vacuum; it is the ultimate global financial lightning rod, reacting instantly to fluctuations across the macro-economic landmass. This volatility is maximized during top-tier economic print events. To discover how structural depth is systematically cleared during data releases, review our analysis detailing the impact of US NFP and CPI data prints on gold order-book microstructure anomalies.
Quantitative gold operations must track two primary external instruments:
- US 10-Year Real Yields (US10Y Adjusted for Inflation): Gold is a non-yielding asset class—holding it provides no dividend stream or yield coupon. Therefore, when real interest rates rise, the opportunity cost of holding gold expands dramatically, motivating global fund managers to rotate capital out of precious metals and into sovereign debt instruments. This creates an institutional sell-side drift.
- The US Dollar Index (DXY Matrix): As spot gold is globally priced in US Dollars, its price reflects a direct inverse mathematical function of fiat purchasing power. A strengthening dollar naturally exerts a mechanical downward drag on gold valuation metrics, independent of localized commodity demand.
When these underlying macroeconomic drivers align, gold trends can sustain extensions far beyond what any standard technical oscillator classifies as overbought or oversold. Attempting to trade reversals based on isolated low-timeframe indicators while real yields are collapsing is a guaranteed recipe for geometric drawdown decay.
The Macro Synchronization Matrix
To maintain an objective perspective on how underlying macro-drivers and session liquidity blocks influence execution risk profiles, study our structured risk routing index:
| Real Yield / DXY Alignment | Order-Book State | Systematic Bias | Execution Risk Rating |
|---|---|---|---|
| Yields Falling + DXY Weak | Thick Buy Side Liquidity / Resting Limit Support | Strong Bullish Expansion Bias | Low Variance (High Systematic Edge) |
| Yields Falling + DXY Strong | High Invariant Volatility / Symmetrical Whiskeys | Neutral / Sidelined Range-Bound Bound | Elevated Spread Risk |
| Yields Rising + DXY Weak | Erratic Spreading / Low Liquidity Depths | Mean Reversion Target Logic Only | Moderate Whipsaw Threat |
| Yields Rising + DXY Strong | Thick Sell Side Liquidity / Aggressive Market Orders | Strong Bearish Contraction Bias | Low Variance (Trend Alignment Target) |
Mathematical Mitigation: Calibrating the Position Engine
Deploying an automated strategy or manual system in a high-volatility commodity market like spot gold without using a dynamic lot-sizing framework is a mathematical guarantee of long-term account ruin. Because gold's True Range variance expands exponentially during macro stress events, a fixed lot-size configuration creates highly asymmetric risk profiles. A 30-pip stop loss in a quiet market carries an entirely different asset weight than a 150-pip structural boundary during a volatile session.
This intense, rapid expansion often induces extreme behavioral errors in under-prepared operators, triggering irrational over-leveraging and emotional trade management. To decouple human behavioral errors from live data streams, explore our diagnostic roadmap detailing gold trading psychology parameters and how to hardcode rules to stop overtrading.
To achieve systematic consistency, position sizes must scale dynamically based on structural stop-loss distances. Prior to submitting trade packets to the market server, developers must use precision calculation engines to cross-reference account structures against market variables. Utilizing a specialized Gold Position Size Calculator ensures that position sizes scale down appropriately as structural stop distances expand, keeping capital exposure uniform.
For advanced developers managing corporate capital or navigating rigorous prop firm performance assessments, maintaining a strict maximum daily loss boundary is a primary rule. If your algorithmic pipeline suffers consecutive stop-outs during a high-volatility liquidity sweep, tracking your aggregate risk profile using an analytical Prop Firm Drawdown Calculator protects your portfolio from hitting institutional liquidation thresholds. If an account has already sustained notable drawdowns due to unmitigated market slippage, operators should study our comprehensive recovery playbook on recovering systematically from compounding drawdown phases to repair equity trajectories over an optimal sample distribution series.
Conclusion: Embracing Institutional Realities
Achieving elite performance in the spot gold marketplace requires abandoning retail speculative habits. Stop treating volatility as an emotional trigger, and stop tracking isolated indicators that fail when market depth evaporates. Enforce macro correlation parameters, build execution routines around institutional liquidity pools, maintain rigid risk models via dynamic calculation suites, and allow mathematical expectancy to manage your capital growth goals over the long horizon.
Gold Liquidity & Volatility FAQ
Why does spot gold (XAUUSD) exhibit extreme intraday liquidity voids compared to major FX pairs?
Unlike standard G10 fiat pairs, spot gold functions simultaneously as a commodity, an inflation hedge, and an absolute safe-haven asset class. During severe macroeconomic structural shifts or geopolitical escalations, Tier-1 liquidity providers instantly widen their bid-ask spreads or temporarily pull resting limit orders from the book. This immediate evaporation of depth creates sharp price gaps and cascading order-flow cascades.
How does real-time bond yield correlation affect gold algorithmic modeling?
Gold possesses a highly sensitive, historically continuous negative correlation with real yields, particularly the US 10-Year Treasury Note (US10Y). Because gold is a non-yielding tangible asset, an increase in real yields elevates the opportunity cost of holding metal reserves, causing systematic capital liquidation. Modern quantitative models monitor real yield algorithmic drift to dynamically adjust directional alpha weights in XAUUSD execution matrices.
What is an institutional liquidity hunt, and how does it manifest on a gold chart?
An institutional liquidity hunt represents a systematic price manipulation sequence where large-scale market participants purposefully push spot prices past historical structural highs or lows. This targeted movement intentionally activates heavy clusters of retail buy/sell stop orders and stop-loss pools, generating the massive counterparty trade volume required for institutional desks to clear their own sizable order blocks without massive self-induced slippage.
How should automated multi-timeframe systems handle sudden spread widening during session roll-overs?
Algorithms must explicitly query the live spread delta via native functions like SymbolInfoInteger(_Symbol, SYMBOL_SPREAD) before transmitting execution packets. If the live spread exceeds a predetermined variance threshold (such as the 30-day moving average spread plus two standard deviations), the execution routine must immediately abort, preserving portfolio capital from toxic slippage anomalies.
Why is static percentage position sizing structurally fatal when trading high-volatility commodities?
Static percentage position sizing assumes that market volatility remains uniform. In reality, gold's True Range variance expands exponentially during macro stress. Utilizing uncalibrated lot configurations across varying historical environments means a 20-pip stop loss in a quiet market carries the identical asset weight as a 120-pip structural boundary in a volatile market, breaking mathematical expectancy configurations.