In systematic Smart Money Concepts (SMC), mapping structural support and resistance fields using ambiguous, subjective trend-lines or generic retail software indicators is a primary failure vector. Institutional capital leaves distinct, rule-based footprints within the global order book. To extract a genuine, high-probability mathematical edge, a structural operator must apply strict mechanical validation guidelines. Rather than drawing broad, unrefined zones that unnecessarily inflate capital risk, professional trading demands exact structural anchors. This deep-dive tutorial establishes the precise quantitative architecture for isolating Demand and Supply Zones using a highly specialized candle body to wick edge alignment method to systematically secure asymmetric trend-following entries.
The Paradigm of Refinement: Why Mechanical Boundaries Matter
Many retail traders correctly recognize that an order block represents the final counter-candlestick sequence before an aggressive expansion. However, they routinely map entire multi-candle clusters blindly, causing their validation parameters to expand to unmanageable proportions.
As established in our foundational core matrix, The Ultimate Guide to Multi-Timeframe Supply and Demand Trading for Structural Operators, minimizing capital exposure on lower-timeframe charts requires clean structural nesting. By applying precise rules to the anatomy of a candlestick pair, we capture the dense core of institutional mitigation while keeping our structural protective levels mathematically optimized.
The Blueprint for Precision Demand Zones
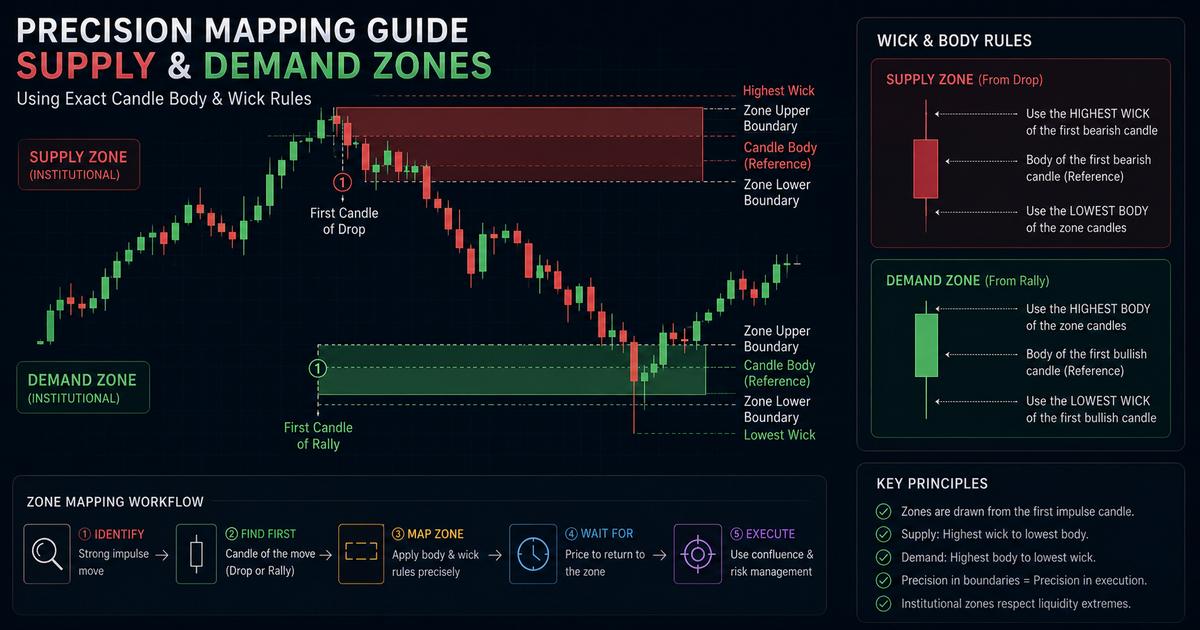
A high-probability Demand Zone represents the ultimate zone of asset accumulation. When institutional participants deploy significant long allocations, they engineer a rapid displacement that leaves behind incomplete order fills. To chart this specific structural block with maximum replication accuracy, operators must implement the following rule-based boundaries on a designated candlestick pair:
- The Upper Boundary (Proximal Line): Locate the very first bearish candle body that initiated the downward liquidity capture before the aggressive bullish reversal. Draw the proximal baseline directly at the open or body threshold of this first candle.
- The Lower Boundary (Distal Line): Scan the localized candle cluster to isolate the absolute lowest wick boundary printed among the candlestick pair. This terminal wick low marks the structural stop-loss validation anchor.
By framing your demand zones strictly from the first candle's body down to the lowest wick, you eliminate subjective guesswork. When price later retraces to rebalance inefficiencies, this framework identifies the precise pocket where institutional buying interest is heavily concentrated.
The Inverse Blueprint for Precision Supply Zones
Conversely, charting an institutional Supply Zone requires an identical mechanical operation mapped inversely across distribution architecture. In a trend-following short framework, supply represents the localized engine of heavy institutional distribution.
- The Lower Boundary (Proximal Line): Isolate the first bullish candlestick body that drove upward liquidity matching immediately before the aggressive bearish displacement occurred. Establish your entry tracking boundary directly at the opening body layer of this first candle.
- The Upper Boundary (Distal Line): Identify the absolute highest wick extension printed within that specific candle cluster. This extreme wick apex serves as your definitive mechanical stop-loss boundary.
This mechanical strictness ensures that you never fall victim to minor counter-trend liquidity sweeps. If price breaches the distal line via a sustained candle body closure, the structure is instantly invalidated, allowing you to cut exposure with micro-level efficiency.
Validating the Structural Edge with Trend-Following Filters
Isolating precision boundaries is only half of the structural equation. To successfully deploy this blueprint, a zone must possess structural confluence before it is deemed valid for trade execution. Every premium or discount array must fulfill three core criteria:
First, the displacement exiting your mapped boundaries must achieve a clear Break of Structure (BOS) or a definitive Change of Character (CHoCH) on the tracking chart. If you need a refresher on validating these specific trend continuation triggers via body closures, review our comprehensive structural guide on Mastering Market Structure: What are BOS and CHoCH?.
Second, the aggressive breakout must leave an immediate Fair Value Gap (FVG) directly above the proximal boundary of a demand zone, or below the proximal boundary of a supply zone. This structural gap confirms massive capital commitment, verifying that major algorithmic order blocks were left unmitigated.
Asymmetric Risk Control and Quantitative Position Sizing
Transitioning to this body-to-lowest/highest-wick methodology will drastically compress your validation boundaries, often shrinking your protective exposure down to precise intervals. While this structural tightening dramatically enhances your potential Risk-to-Reward distribution, it shifts massive tracking requirements onto your portfolio risk engines.
Executing random retail lot sizes on highly refined boundaries is an unstable operational vector. Because your protective stop-loss is placed tightly beneath the absolute lowest wick of a demand sequence, minor variance in spread or localized volatility can generate unmanaged drawdowns if capitalization is improperly balanced.
To maintain an enduring mathematical advantage, professional operators filter all execution variables through strict risk parameters. Utilizing our advanced Prop Firm Drawdown Calculator ensures that position allocations automatically scale down during high-volatility events, preserving your equity curve and keeping your daily parameters completely locked within secure funding mandates.
Conclusion: Eliminating Subjectivity from Your Charts
Precision zone mapping requires trading without emotional interpretation. By binding your proximal anchors directly to the first candle body and pinning your distal protection layers precisely to the lowest or highest structural wicks, you eliminate the ambiguity that causes retail performance degradation. Let macro institutional order flow dictate your trend-following targets, manage your position configurations with quantitative exactness, and execute with absolute structural confidence.
Precision Mapping & Order Flow FAQ
Why use the first candle body instead of the entire candlestick to map a demand zone?
Mapping from the first candle body to the lowest wick isolates the core institutional order-matching volume while drastically refining the structural stop-loss distance. This structural precision yields a significantly tighter validation boundary compared to broad retail zone indicators.
How do you mechanically map an institutional Supply Zone boundary?
Conversely to a demand zone, a valid institutional supply array is plotted from the opening body of the first bullish candle inside the structural pair up to the absolute highest wick of that specific candle cluster.
What should a structural operator do if a zone lacks an immediate Fair Value Gap (FVG)?
If a structural zone lacks an immediate Fair Value Gap or explicit price displacement, it is classified as low-expectancy noise. Institutional order blocks must leave behind an inefficiency to guarantee massive unfilled resting orders.