In the arena of leveraged financial speculation, market direction is a probabilistic distribution, not a certainty. While retail participants spend their intellectual capital optimizing entry signals, institutional risk managers focus entirely on the mathematical engine that preserves survival: position sizing architecture. Irrespective of a system's win-rate, improper asset allocation models expose an account to the mathematics of geometric degradation. To survive the extreme volatility profiles of modern Forex and Spot Gold (XAUUSD) markets, an operator must deconstruct and master the exact formulas governing risk-unit delivery.
The Fallacy of Fixed Lot Allocation
The most prevalent threat to operational longevity is the usage of static or arbitrary lot allocations—such as executing exactly "1.00 lot" across diverse asset distributions. This approach assumes that all financial instruments possess uniform risk profiles. In reality, a standard lot represents drastically different economic commitments depending on the underlying contract specifications.
When you execute setups on currency configurations or commodities without factoring in localized volatility distributions, your real-world risk per trade swings chaotically. To understand how unhedged exposure vectors can compromise an evaluation path or a live account under sudden margin events, read our detailed institutional analysis explaining how leverage models turn toxic for retail portfolios.
The Core Mathematical Formula
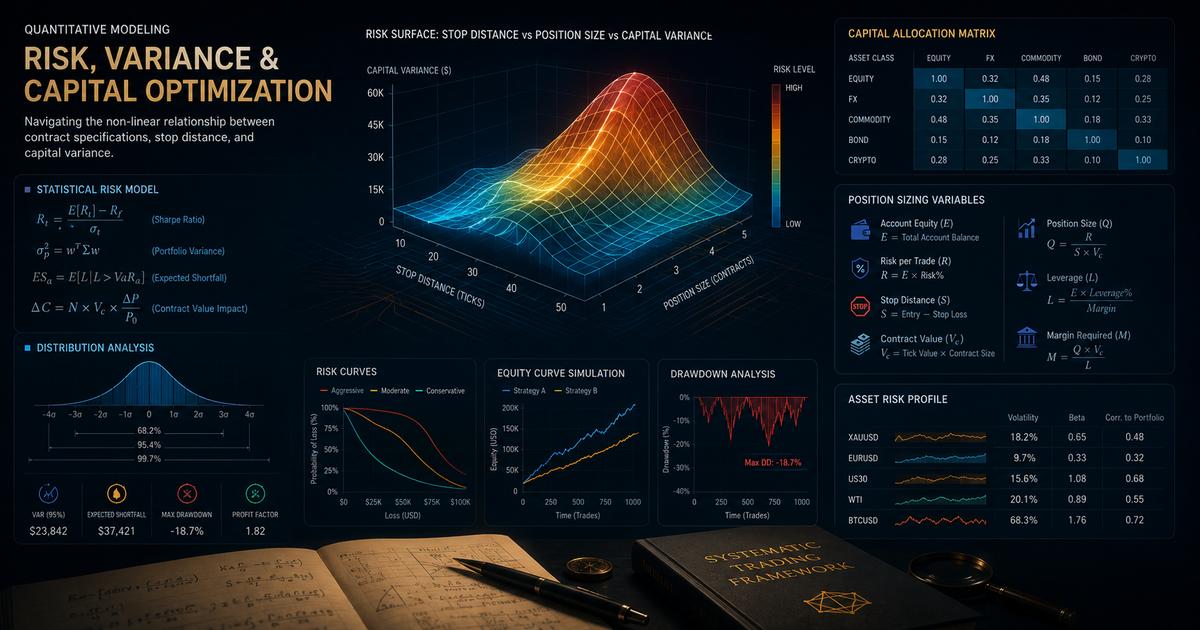
To eliminate systemic variability, position sizing must adjust dynamically based on technical stop-loss distances and specific contract values. The quantitative algorithm required to calculate standard lot allocation is structured as follows:
By isolating the allowed loss as a fixed percentage of total capital, your absolute financial liability remains completely uniform regardless of whether a setup requires a tight 10-pip intraday stop or a wide 150-pip structural swing stop. The lot allocation scales inversely to the stop-loss distance, creating a bulletproof mathematical buffer against market anomalies.
Test the Theory: Live Multi-Asset Risk Calculator
Input your current account metrics below to see the exact fractional position sizing formulas resolve in real time prior to deploying terminal capital.
Forex Position Size Calculator
Amount at Risk: $0.00
Neutralizing Gold (XAUUSD) Microstructure Volatility
Spot Gold requires distinct mathematical parameters due to its significant average daily range. While traditional major currency pairs might fluctuate across a tight 0.5% boundary daily, Gold easily registers multi-percentage intraday expansions.
Furthermore, Gold contract specifications dictate that 1.00 standard lot controls exactly 100 troy ounces. This means a single $1.00 directional delta in the spot price translates to a $100.00 fluctuation in account equity. If you are executing high-frequency setups within these environments, standard calculations must be verified via dedicated tools to prevent catastrophic drawdowns. For a precise breakdown tailored explicitly to gold contract boundaries, deploy our optimized Gold Position Size Calculator before setting live orders.
The Risk of Ruin: Understanding Statistical Asymmetry
Many operators mistakenly believe that recovering from a drawdown sequence is a linear mathematical path. This cognitive error is what destroys capitalizing traders. The geometric reality of loss recovery is asymmetrical; as equity decreases, the percentage growth required to achieve break-even increases exponentially.
| Account Drawdown Level | Required Recovery Growth | Risk of Ruin (At 2% Per Trade) | Risk of Ruin (At 5% Per Trade) |
|---|---|---|---|
| 10% Drawdown | 11.1% | 0.2% | 4.5% |
| 20% Drawdown | 25.0% | 1.5% | 18.2% |
| 30% Drawdown | 42.8% | 5.1% | 45.8% |
| 50% Drawdown | 100.0% | 12.5% | 98.9% |
As demonstrated by statistical models, increasing your risk threshold from 2% to 5% per trade does not simply double your vulnerability—it accelerates your mathematical probability of total account liquidation toward near certainty during standard variance distribution sequences. If your capital structures have fallen victim to compounding losses, navigating out of these zones requires a systematic approach. Review our master tactical framework on recovering systematically from severe trading drawdowns to restore statistical stability.
Strategic Execution Protocols
To transition from an emotional retail speculator to a quantitative risk manager, you must enforce three strict execution constraints within your daily routing layout:
- The Fractional Ceiling: Establish an absolute upper ceiling for individual trade risk, never exceeding 1% of total account valuation on standard entries.
- Real-Time Exchange Adjustments: Ensure all non-USD account base currencies are dynamically recalculated to account for shifting pip conversions.
- Pre-Execution Calculation Verification: Mandate that every lot allocation size is algorithmically generated via validation toolsets prior to trade transmission.
Conclusion: Let the Probabilities Play Out
Long-term profitability in financial speculation is the byproduct of large sample sizes operating under positive mathematical expectancy. By mastering position sizing, you isolate your portfolio from the danger of single-trade outliers. You transform risk management from a defensive afterthought into an offensive edge, guaranteeing that your execution platform survives to harness compounding growth trends over time.
Risk Architecture & Position Sizing FAQ
What is the Risk of Ruin in quantitative trading?
The Risk of Ruin is a mathematical concept that calculates the probability that a trader will lose their capital to the point where trading can no longer continue. It is not linear; an increase in risk per trade from 1% to 5% increases the risk of ruin exponentially, especially during inevitable consecutive losing streaks.
Why does standard lot sizing fail when moving from Forex to Gold?
Forex pairs move in pips based on 4-decimal increments, while Gold (XAUUSD) moves in dollar deltas (ticks) with much higher Average True Range (ATR). A 1-standard lot trade on Gold exposes your account to significantly higher capital variance per tick compared to a standard currency pair.
How does account base currency affect position sizing math?
If your account base currency differs from the quote currency of the asset (e.g., trading GBPUSD on a EUR account), the calculation engine must convert the pip value dynamically based on the current exchange rate of the conversion pair to maintain precision.
Can stop-loss placement be determined solely by a position sizing calculator?
No. Technical stop-losses must be derived from market structure, liquidity zones, or volatility metrics (like ATR). Once the stop-loss distance is determined technically, the position sizing calculator is used to solve for the exact lot size allowed.
How do compounding models adjust position sizes dynamically?
A fixed-fractional compounding model keeps the risk percentage constant (e.g., 1%). As your total closed account balance fluctuates up or down, the absolute dollar value allocated to risk adjusts proportionally, automatically scaling down during drawdowns.