Transitioning from a standard funded specification layer into an institutional asset tier requires a profound shift in operational metrics. Modern proprietary funding entities do not allocate substantial multi-figure account expansions based on subjective performance summaries or lucky, oversized positions. Instead, corporate risk boards mandate deep, data-validated proof of a strategy's edge. To successfully enter a Scaling Plan, a professional retail operator must audit, verify, and present precise performance tracking metrics—anchored completely by the mathematical relationship between Win Rate ($W$) and average Risk-to-Reward ($R$).
1. The Scaling Criteria: What Funding Engines Actually Audit
Emerging traders often assume that merely hitting a structural profit target over consecutive payout milestones automatically unlocks a capital expansion tier. In real institutional operations, this assumption is flawed. Funding engines deploy automated statistical models to review your account history. They actively filter out reckless operators who hit targets by taking erratic risks or relying on massive single-trade windfalls during volatile news cycles.
To separate sustainable talent from random distribution curves, automated risk managers look for a stable performance profile. This means demonstrating a reliable combination of win rate, consistent positioning, and tightly controlled drawdown levels over an extended validation matrix.
2. Mathematical Formulas for Real System Expectancy
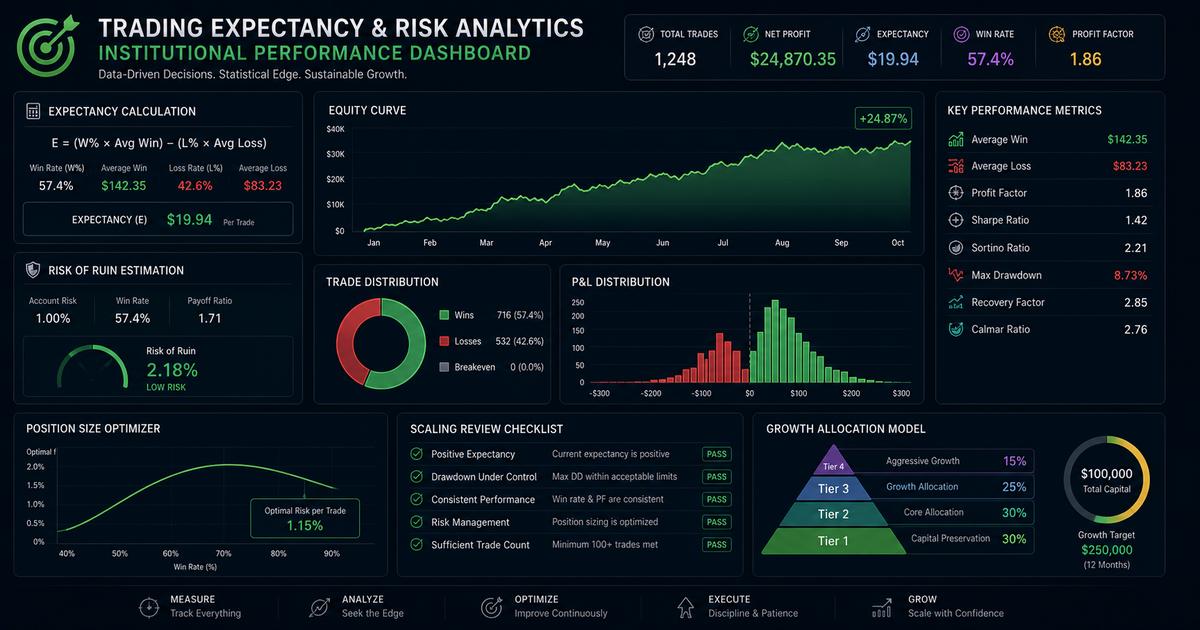
The most foundational step in preparing a portfolio for a corporate scaling review is calculating its mathematical Expectancy ($E$). Expectancy represents the average dollar amount (or percentage metric) an operator expects to generate per executed lot over a significant historical sampling pool.
The core equation incorporates both system win-rate percentages and average loss thresholds. To derive your true system expectancy profile, apply the following structural formula:
Where the loss rate is simply derived as $1 - Win\ Rate$. If your generated output yields a negative decimal variable, your underlying trading logic is fundamentally unscalable. Any attempt to expand capital limits with a negative expectancy profile will eventually result in an automated daily loss violation.
To maintain structural safety and prevent these server-side liquidations, you must keep your maximum risk parameters securely locked. For a complete guide on aligning your execution logic with these strict server boundaries, explore our core pillar guide on The Science of Daily Drawdown: How to Never Breach Prop Firm Rules.
| Win Rate Percentage ($W$) | Minimum Required R:R Ratio ($R$) | Scaling Viability Status |
|---|---|---|
| 30% | 1 : 2.50 Minimum | Viable with Strict Volume Controls |
| 40% | 1 : 1.75 Minimum | Highly Scalable Asset Matrix |
| 50% | 1 : 1.20 Minimum | Optimal Consistency Framework |
| 60% | 1 : 0.80 Minimum | High Probability - Capital Shielded |
3. Normalizing Realized Risk-to-Reward Against Slippage
A frequent point of friction for expanding traders is the deviation between a system's theoretical Risk-to-Reward ratio and its realized historical performance profile. An operator may design an MQL5 Expert Advisor or a manual strategy around a structured 1:2 entry bias on a pair like GBPUSD. However, real-world execution environments introduce friction points like order latency, commissions, swap fees, and execution slippage.
commissions and unfavorable slippage inevitably push your actual realized entry and exit prices beyond your planned parameters. This shifts your real metrics to a lower level, such as 1:1.65. When reviewing accounts for scaling plans, proprietary risk systems track your realized results, not your theoretical designs. Therefore, optimizing execution speed and using precise contract sizing calculations is critical to protecting your true system expectancy.
4. Auditing Your System Consistency and Distribution Strips
To construct a compliant scaling presentation dossier, you must analyze your historical performance across three core mathematical areas:
- Distribution Uniformity: Your profit curves must be evenly distributed across a large pool of trades, rather than relying on a few massive, unmanaged positions during high-volatility events.
- Consecutive Loss Tolerances: Calculate your maximum historical losing streaks to ensure your account buffers can survive drawdown cycles without breaching your absolute daily loss ceilings.
- Asset Variance Tuning: Track your performance across individual pairs. Keep your allocations focused on highly stable forex instruments, while systematically scaling down lot sizes on highly volatile assets.
5. Recovering Account Stability After Validation Volatility
If your metrics undergo a temporary performance decline or experience erratic variances while you are actively working toward a capital scaling milestone, you must avoid the urge to manually force trade volumes to compensate. Forcing large positions under choppy market conditions typically skews your data profiles further, signaling a lack of discipline to the automated tracking algorithms.
Instead, immediately reduce your session exposure limits and re-establish your baseline metrics through a structured framework. For an actionable guide on systematically stabilizing and rebuilding your account profiles after a performance drag, consult our comprehensive Trading Drawdown Recovery Guide.
Locking in Capital Parameters via Precision Sizing Frameworks
Never try to guess your current account expectancy or estimate performance metrics on the fly when managing corporate capital allocations. To qualify for long-term scaling programs, you must verify your data layers through rigorous, systematic analysis.
Utilizing automated position tools allows you to dynamically adjust your lot parameters to match historical volatility profiles, ensuring your strategy maintains the exact performance metrics required for corporate capital growth.
Conclusion: Mathematical Consistency Secures Institutional Expansions
Securing a corporate portfolio expansion has very little to do with market forecasting or spotting hidden chart patterns. It relies entirely on demonstrating a stable statistical edge backed by positive mathematical expectancy. By accurately calculating your true win rates, protecting your realized risk-to-reward ratios from slippage, and keeping entries locked beneath strict algorithmic parameters, you align your strategy with institutional scaling requirements. Master your mathematical metrics, and your corporate funding limits will scale up naturally.
Prop Firm Metrics Scaling FAQ
What metrics do prop firms look for before approving an account scaling plan?
Proprietary risk committees evaluate a combination of consistency scores, positive mathematical expectancy, and drawdown control. Simply hitting a profit target is insufficient; an operator must demonstrate that their average win rate and average risk-to-reward ratio are structurally stable over a multi-month execution cycle without exploiting massive single-trade windfalls.
Can a low win rate strategy qualify for a corporate capital expansion plan?
Yes. A system with a low win rate (e.g., 35%) can easily qualify for capital scaling provided its average risk-to-reward profile remains consistently high (e.g., 1:3 or greater). The core engine behind allocation increases is positive mathematical expectancy, not an arbitrarily high win-rate percentage.
How does sudden slippage during volatile sessions skew calculated R:R metrics?
Slippage expands the actual realized risk envelope while compressing the target reward zone. If a stop-loss is triggered within these order vacuums, the clearing server executes the liquidation at the next available market quote, far worse than the designated parameters. This extreme divergence can instantly breach a portfolio's strict maximum daily loss ceiling.