Viewing financial markets through a single chart interval is akin to looking through a keyhole. To identify institutional order flow, you must master the synchronization of disparate market fractal matrices.
The Retail Delusion: The Single-Timeframe Trap
A vast majority of retail participants execute trades exclusively within one selected timeframe. Day traders sit frozen over the 1-minute or 5-minute charts, watching immediate candlestick updates, while swing traders track patterns on the 4-hour interval. This localized perspective breeds extreme structural blind spots.
When you execute setups using an isolated interval, you are essentially trading blind to the broader market context. A perfectly clean bullish breakout pattern on a 5-minute chart can manifest exactly inside a major, unmitigated institutional Supply Zone on a Higher Timeframe (HTF) like the 1-Hour or 4-Hour chart. The result? The breakout fails instantly, trapping retail liquidity as smart money algorithms aggressively reject the asset lower.
Professional technical analysis requires an understanding that markets are fundamentally fractal. Patterns and trend formations replicate across all chart intervals, but the higher structural frames dictate absolute market direction.
🛡️ Risk Framework Integration: Even the most accurate multi-timeframe directional bias encounters random stop-loss hunt anomalies. Before allocating capital to dynamic trend entries, check out our baseline guide on Position Sizing 101: The Math Behind Long-Term Trading Success.
The Architecture of Top-Down Market Mapping
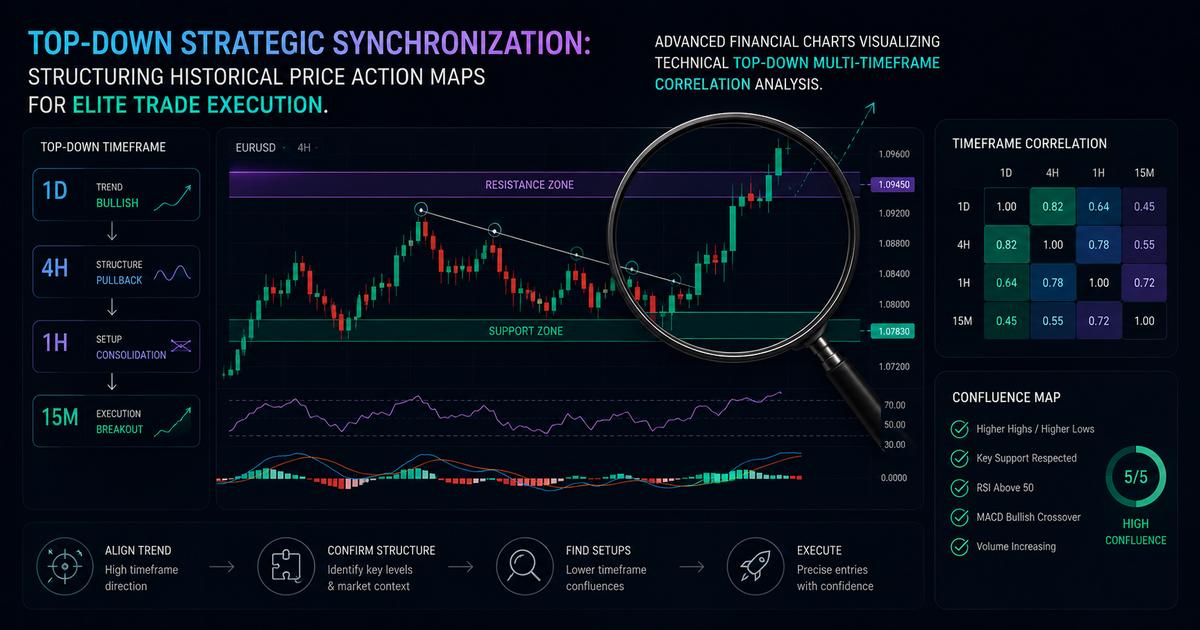
Multi-Timeframe Analysis (MTF) shifts your process from intuitive guessing to structural mapping. Elite quantitative frameworks rely on a strict three-tier hierarchy to maintain absolute situational awareness:
- The Macro Anchor (Trend Direction): This is your compass. It is used exclusively to evaluate who controls the dominant market engine—the buyers or the sellers. For professional day traders, the 1-Hour (H1) or 4-Hour (H4) chart serves as the macro anchor. If the market is printing consecutive higher-high structural breaks above the 200 EMA on H1, shorts are completely forbidden.
- The Structural Filter (Zone Isolation): The intermediate interval (e.g., the 15-Minute chart) is used to map critical structural landmarks, including high-probability Demand Zones, liquidity pools, and significant order blocks.
- The Micro Execution Trigger (Entry Calibration): The lowest operational interval (e.g., the 1-Minute or 5-Minute chart) is used strictly to spot price rejection mechanics and enter the position with a tighter invalidation distance, dramatically increasing your potential Reward-to-Risk ratio.
Algorithmic Rule Coordination: Synchronizing the Gears
To transform top-down analysis into an objective, automated system suitable for algorithmic Expert Advisors (EAs) or high-frequency retail execution, you must define concrete structural alignment parameters.
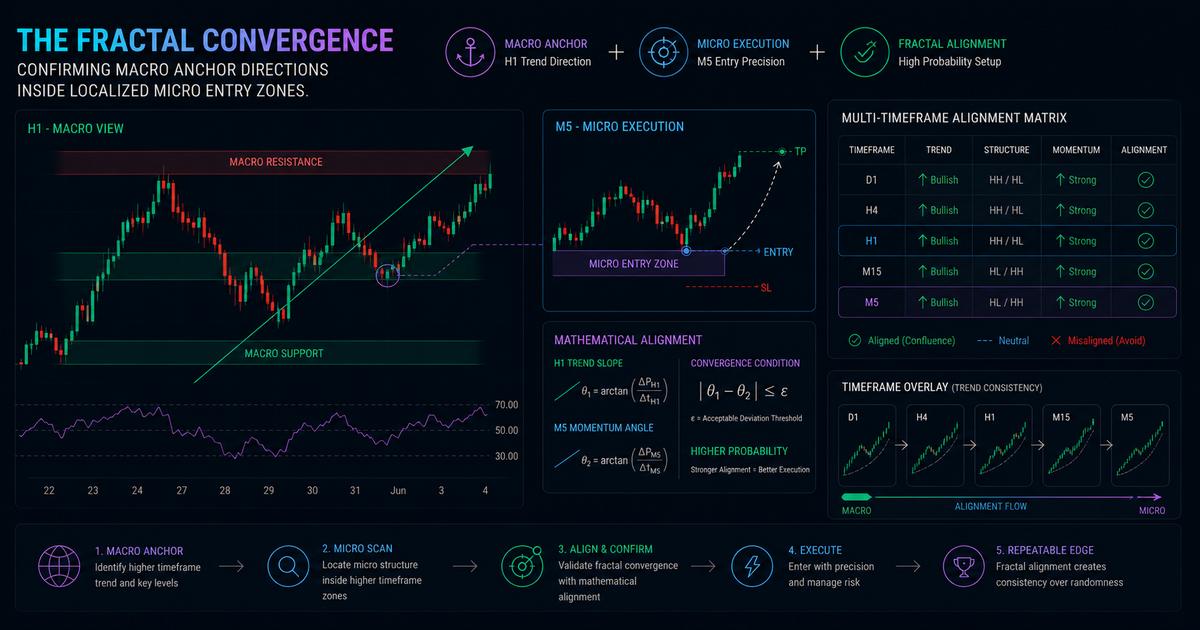
Imagine tracking a major currency cross like GBPUSD. Your H1 chart reveals a long-term bullish bias, supported by an upward-sloping 200 Exponential Moving Average (EMA). In this scenario, your trading desk establishes a strict structural directive: Look for longs only.
Next, you monitor price action as it undergoes a technical pullback into an unmitigated H1 Demand Zone. As soon as price strikes the boundary of the higher timeframe zone, you drop down to your M1 or M5 execution chart. You do not blind-buy immediately. Instead, you wait for a lower-timeframe Change of Character (CHoCH)—a structural break above the recent lower-high candlestick sequence.
By waiting for the M1 or M5 structural gears to shift back into alignment with the dominant H1 engine, you ensure you are entering right as institutional momentum resumes.
🧪 Data Validation: Do not accept multi-timeframe rules on blind faith. You must backtest these specific timeframe coordination matrices over historical market cycles. Read our actionable roadmap on Why Backtesting is the Trader's Ultimate Edge to learn how to lock down your data.
Avoiding Synchronization Paralysis: The Rule of Three
The primary challenge traders face when adopting multi-timeframe analysis is Analysis Paralysis. If you attempt to monitor five or six different intervals simultaneously—such as the Monthly, Weekly, Daily, H4, H1, M15, and M1 charts—you will inevitably encounter conflicting signals. The Daily chart may look bullish, the H4 chart look bearish, the H1 chart look sideways, and the M5 chart look extremely bullish.
To completely eliminate this cognitive bottleneck, institutional frameworks deploy the Rule of Three. Limit your universe to exactly three complementary intervals based on your trading style:
| Trading Profile | Macro Anchor | Intermediate Filter | Execution Frame |
|---|---|---|---|
| Institutional Day Trader | 1-Hour (H1) | 15-Minute (M15) | 1-Min / 5-Min |
| Core Swing Trader | Daily (D1) | 4-Hour (H4) | 1-Hour (H1) |
| Macro Position Allocation | Weekly (W1) | Daily (D1) | 4-Hour (H4) |
By maintaining a strict triple-timeframe framework, you eliminate psychological clutter. If the intermediate and micro frames conflict with the macro anchor, you simply sit on your hands and wait. Capital preservation is your primary objective.
🏆 Prop Firm Strategic Application: Maximizing your Reward-to-Risk ratio via micro-timeframe confirmations is the single most efficient way to achieve rapid funding target thresholds safely. Deepen your funding knowledge with our comprehensive guide on Prop Firm Mastery: Navigating Rules & Passing Evaluation Challenges.
Conclusion: The Ultimate Edge of Patient Convergence
Multi-Timeframe Analysis demands high levels of discipline. It forces retail participants to step away from instant gratification and wait for the precise moments where macro order blocks and micro candlestick structures reach mathematical convergence.
When you align top-down structures, you stop fighting institutional currents and start riding them. Stop executing chaotic single-frame positions. Map your anchor charts, isolate your execution zones, and let the historical probability metrics take care of the rest.
Multi-Timeframe Analysis FAQ
What is the optimal timeframe ratio for multi-timeframe analysis?
The industry standard dictates a ratio between 4:1 and 6:1 between your operational charts. For example, intraday systematic traders utilize H1 for absolute macro direction and M5 or M1 for precise execution alignment.
How do you resolve a conflict where the Daily chart is bullish but the H1 chart is bearish?
You must obey the higher timeframe structural bias. If the Daily chart is bullish and the H1 chart is moving down, the H1 is historically experiencing a structural pullback. Professional operators wait for the lower timeframe to shift structural alignment back to bullish before executing.
Does multi-timeframe alignment guarantee a 100% win rate?
No trading framework yields a 100% win rate. Multi-timeframe analysis is a statistical filtering mechanism engineered to dramatically increase the mathematical expectancy of your entries and prevent trading against institutional liquidity pools.